
The Linaro Forge suite offers a set of tools, available both graphically and via the command line, tailored for debugging and profiling both parallel and sequential programs. It supports many parallel architectures and models, including MPI, CUDA, and OpenMP. It consists of the following tools:
- Linaro DDT: This tool specializes in parallel high-performance application debugging.
- Linaro MAP: This tool is designed for performance profiling and optimization guidance.
- Linaro Performance Reports: This tool serves for summarizing and characterizing both scalar and MPI application performace.
The documentation is available online.
On the OMNI cluster, Linaro Forge version 23.1.1 is installed. In order to use this debugger, load the debugger/linaro-forge module using the following command:
$ module load debugger/linaro_forgeThe userguide is also available in PDF form inside the installation directory, specifically in the following folder:
/cm/shared/omni/apps/linaro_forge/23.1.1/doc/userguide-forge.pdfLinaro DDT
Linaro DDT is a powerful graphical debugger suitable for many different development environments. This tool supports:
- C, C++, and all derivatives of Fortran, including Fortran 90.
- Limited support for Python. For more information, see Python debugging.
- Parallel languages/models including MPI, UPC, and Fortran 2008 Co-arrays.
- GPU languages such as HMPP, OpenMP Accelerators, CUDA, CUDA Fortran and HIP.
The following steps show the process to use this tool to debug an application.
-
First, load the corresponding module using the following command:
$ module load debugger/linaro_forge -
Start the Linaro DDT as a graphical application in a new window using the following command :
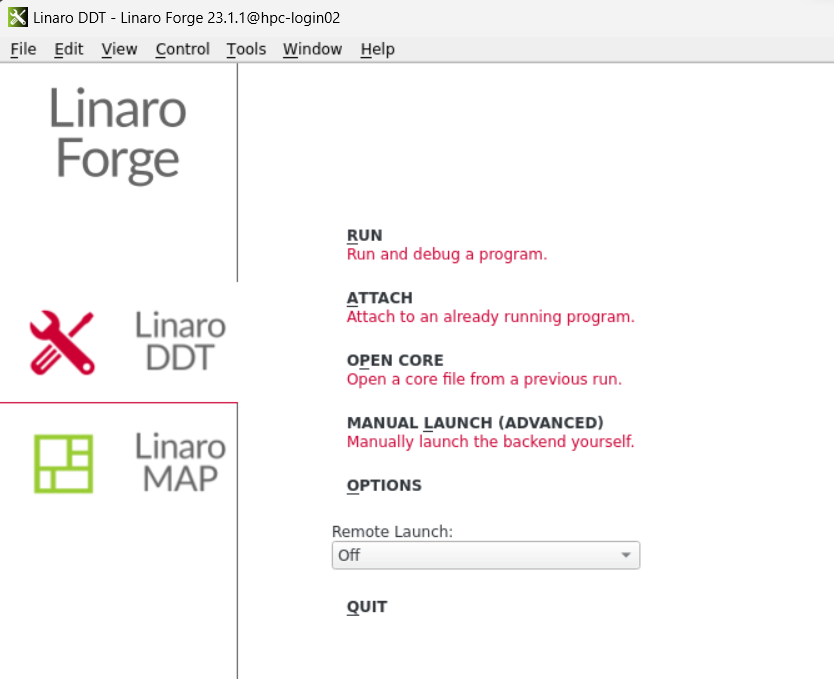
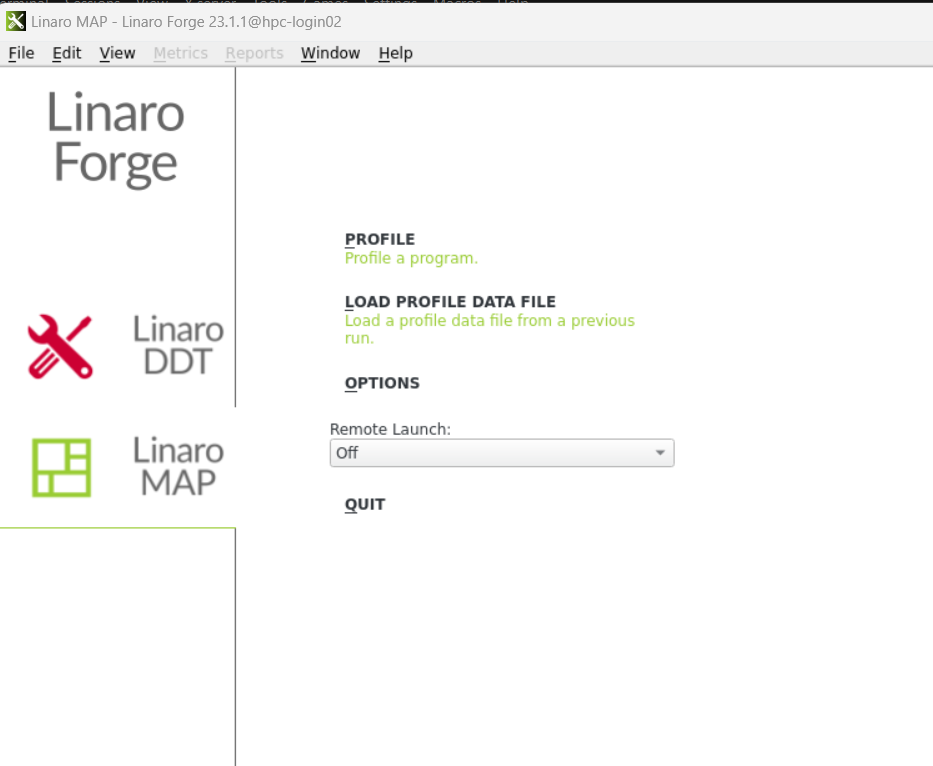
$ ddt &This opens the following window where Linaro DDT is selected by default.
Note: Like all other graphical applications on the cluster, your SSH connection needs to be established with X11 support, and an X server needs to be running on your PC; see also here.
-
To run and debug a program, select the
RUNoption. This opens a new window where the application you want to debug should be selected. Depending upon the type of application, choose the correct options likeOpenMP,MPI,CUDA, etc. Then click on theRunbutton, which opens the DDT interface.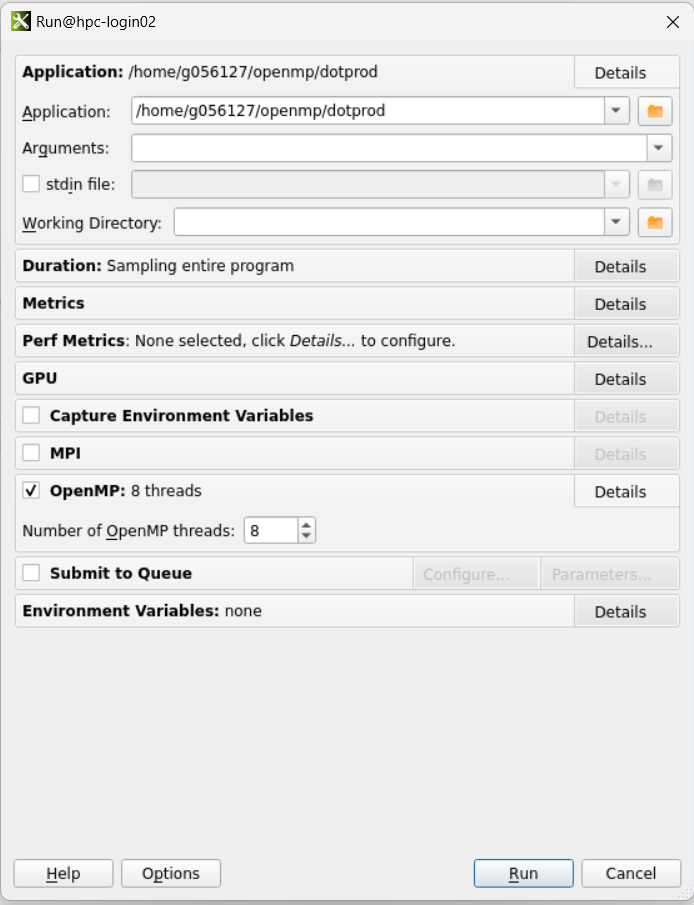
Note: When compiling the program, add a debug flag to your compile command. For most compilers, this is
-g. It is recommended to turn off compiler optimizations as they can produce unexpected results when debugging. -
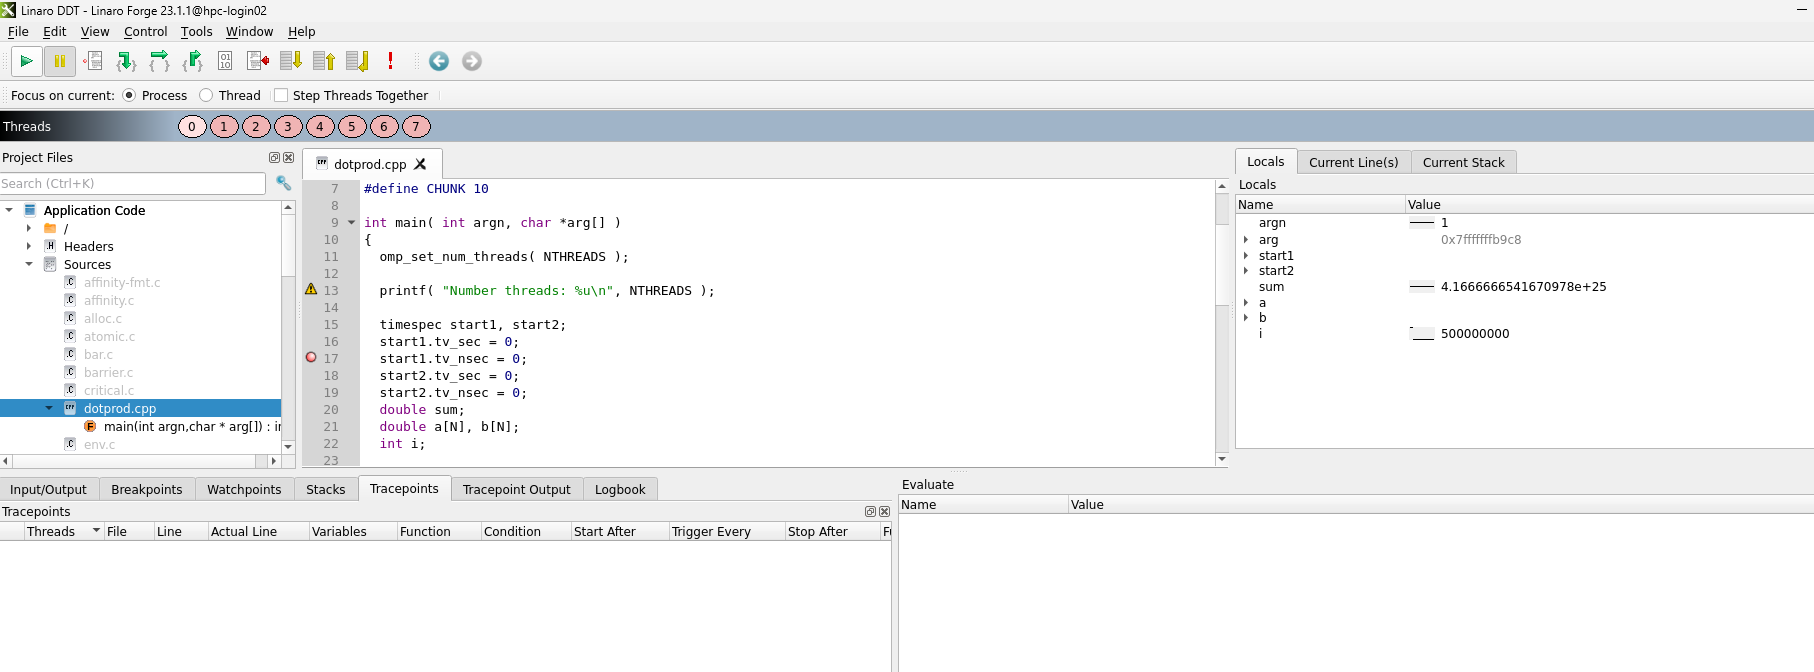
The DDT interface opens a source code viewer where you can set breakpoints, control program execution, trace stacks, etc., for debugging the application. For more details, visit the online documentation.
-
To save the session, select File ‣ Save Session. This exports HTML and text files, which can be viewed using the following command:
$ firefox name.htmlIn this command, replace the
name.htmlwith your own filename. This opens afirefoxwindow where, the overview of the application can be viewed.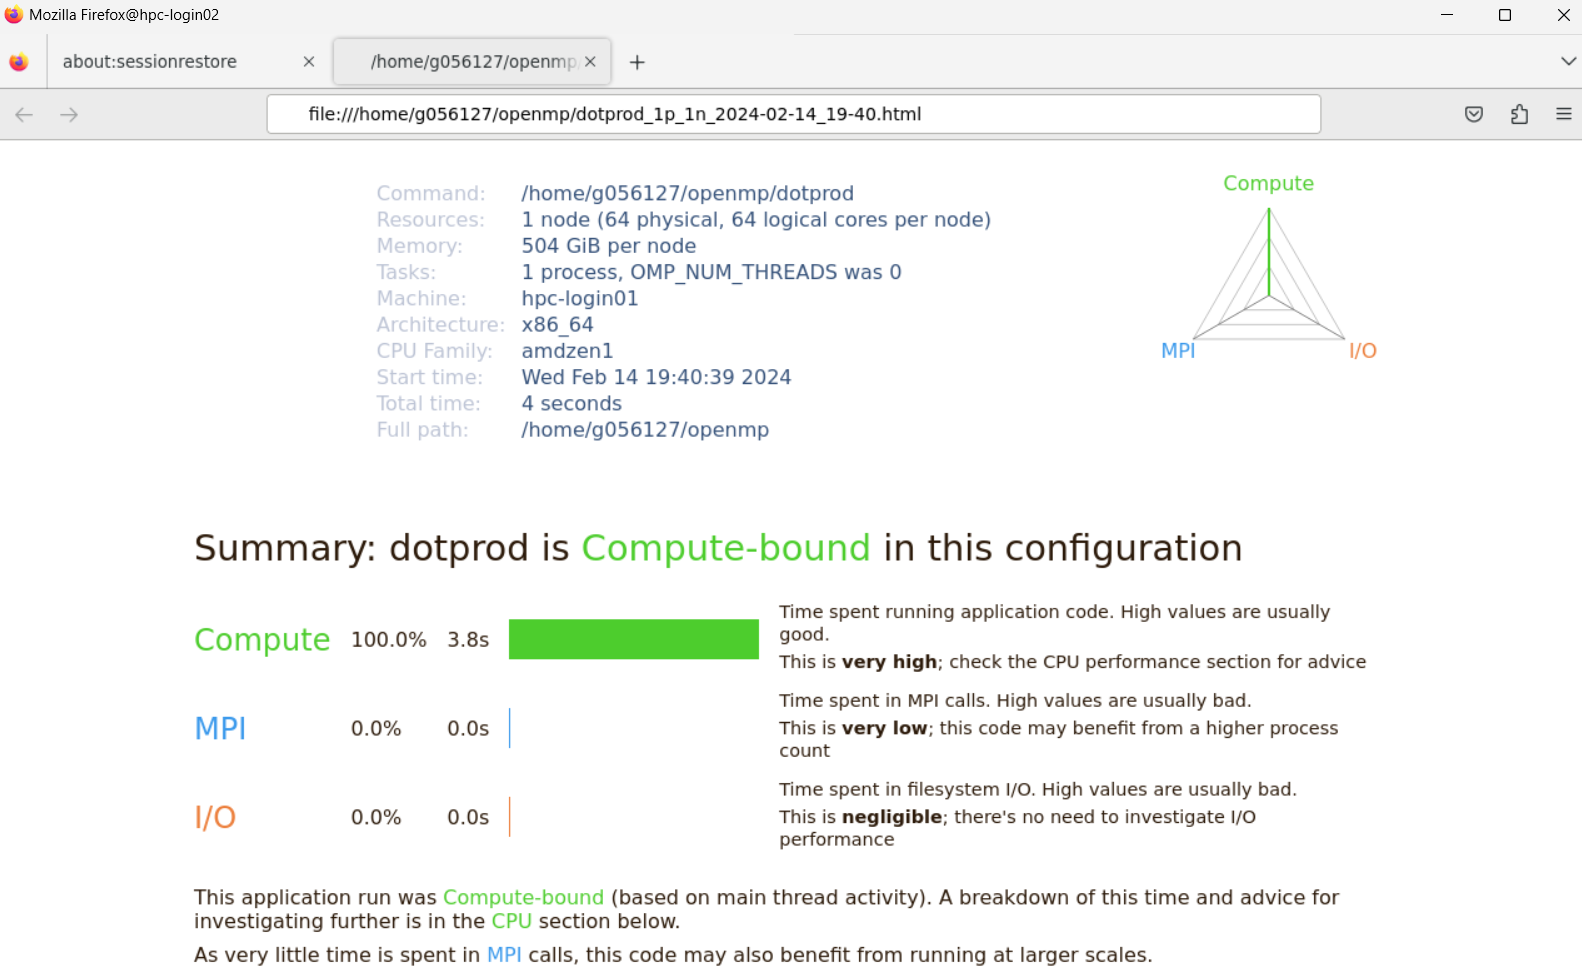
-
To end your current session, select File ‣ End Session.
Using command line
To run DDT without GUI, use following command:
$ ddt --offline ./executable_name.exeUse ddt --help to learn more about the command. The output is generated as HTML file.
Example:
(base) [g056127]$ ddt --offline --openmp-threads=8 ./dotprod
Linaro Forge 23.1.1 - Linaro DDT

Debugging                : /home/g056127/openmp/dotprod
MPI implementation       : Auto-Detect (Open MPI)
Memory debugging enabled : No

Offline log written to: 'dotprod_1p_1n_4t_2024-02-15_19-51.html'
Linaro MAP
MAP is a source-level profiler that shows how much time was spent on each line of code. It shows the longest-running lines of code and explains why.
The following steps show the process to use this tool to debug an application.
-
First, load the corresponding module using following command:
$ module load debugger/linaro_forge/23.1.1 -
Start the Linaro MAP as graphical application in a new window using following command :
$ map &This opens the following window where Linaro MAP is selected by default.
Note: Like all other graphical applications on the cluster, your SSH connection needs to be established with X11 support, and an X server needs to be running on your PC; see also here.
-
To profile a program, select the
PROFILEoption. This opens an interface to select the program and configure the operation. Depending upon the type of application, choose the correct options likeOpenMP,MPI,CUDA, etc. Then click on theRunbutton, which opens the MAP interface.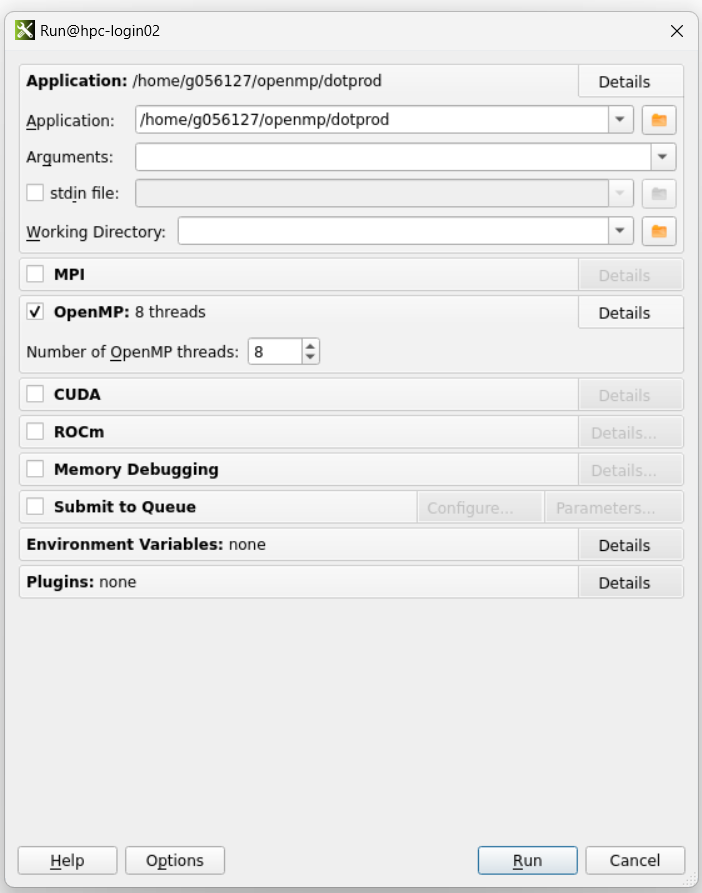
-
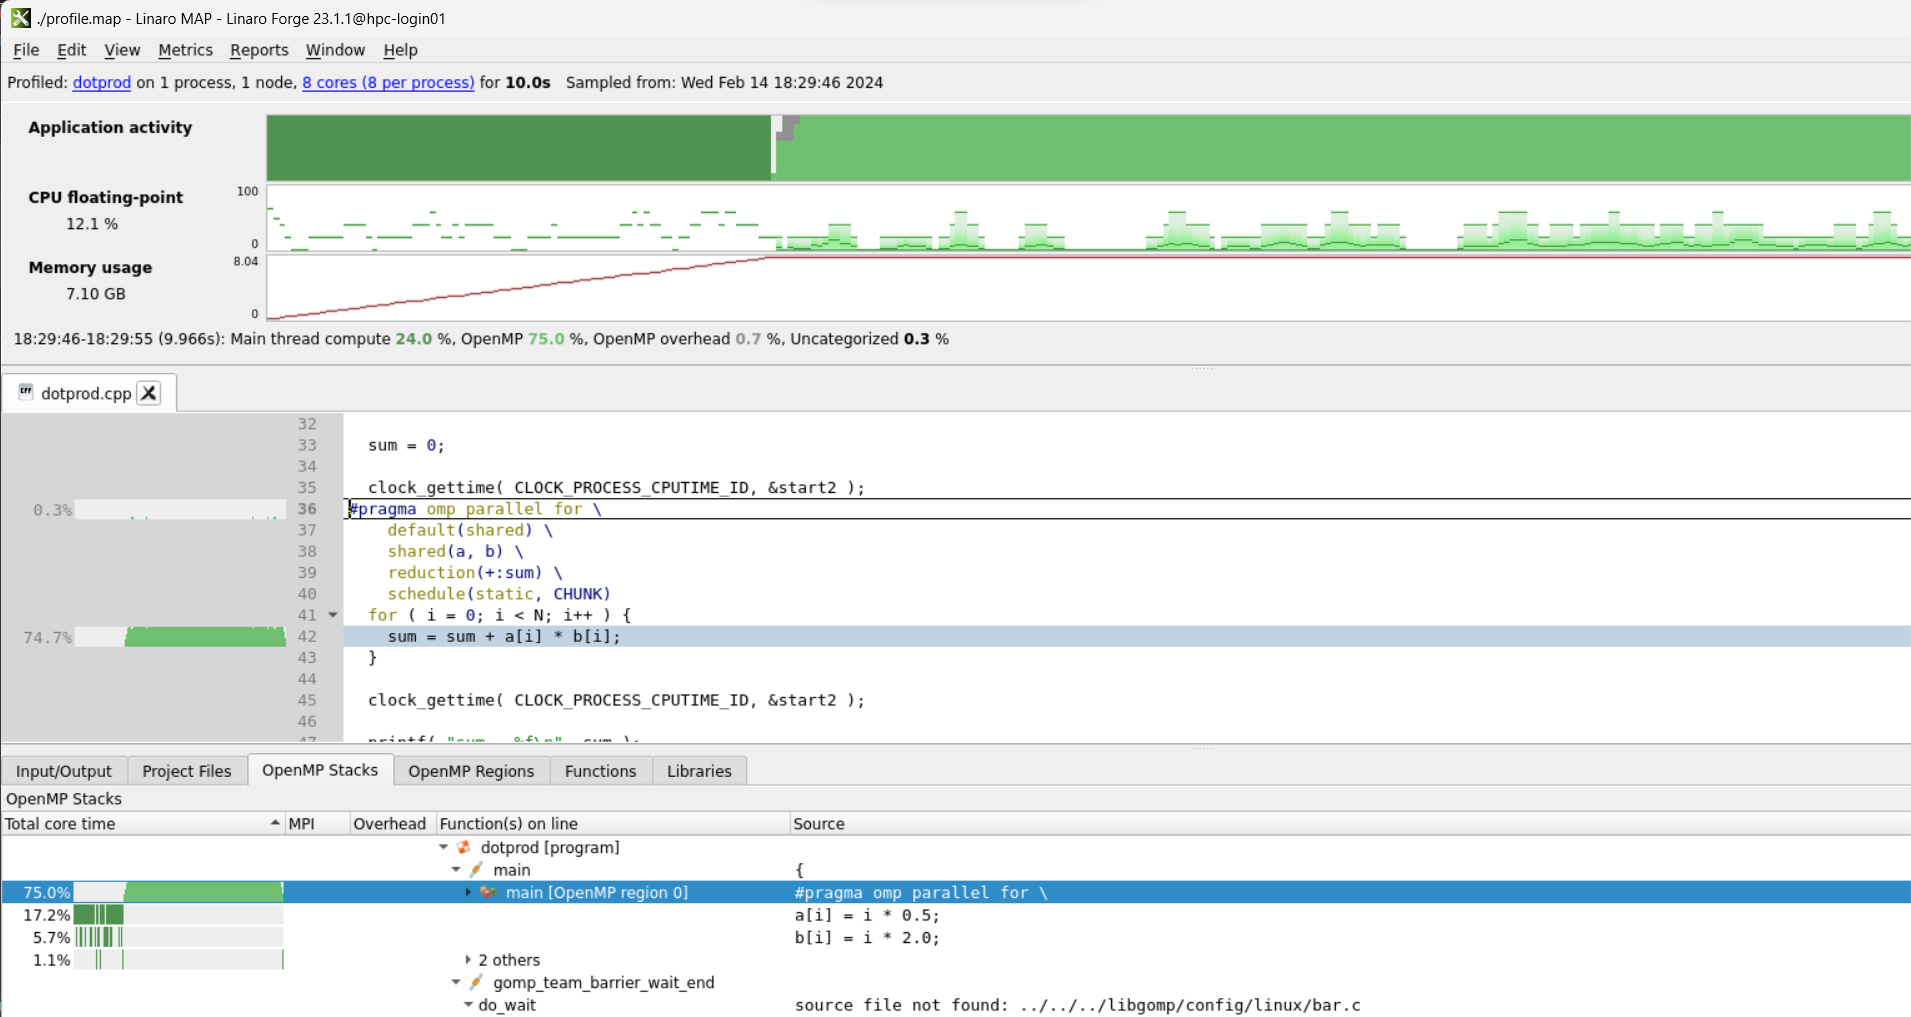
The MAP interface displays the source code, application activity, and metrics like memory usage, CPU usage, etc. It shows the memory and CPU usage for each line of the code.
-
You can save the MAP profile from File ‣ Save Profile Data as. The extension of the file will be
.map. The profile can also be exported asJSONfrom File ‣ Export Profile Data as JSON. The map profile can be re-viewed by using the second optionLOAD PROFILE DATA FILE, from theLinaro MAPhome interface.
Using command line
To run MAP without GUI, use following command:
$ map --profile ./executable_name.exeUse map --help to learn more about the command. This command generates MAP output file with the extension .map.
Example:
(base) [g056127]$ map --profile --openmp-threads=8 ./dotprod
Linaro Forge 23.1.1 - Linaro MAP

Profiling            : /home/g056127/openmp/dotprod
Linaro Forge sampler : preload
MPI implementation   : Auto-Detect (Open MPI)

MAP analysing program...
MAP gathering samples...
MAP generated /home/g056127/openmp/dotprod_1p_1n_8t_2024-02-15_19-57.map

Linaro MAP profiling summary
============================
Profiling time:      4 seconds
Peak process memory: 8042729472 B (~7.49 GiB)

Compute:             100.0%     (3.8s) |=========|
MPI:                   0.0%     (0.0s) |
I/O:                   0.0%     (0.0s) |
  (based on time on the main thread)
Linaro Performance Reports
Linaro Performance Reports provides the most effective way to characterize and understand the performance of HPC application runs.
One single page HTML report answers a range of vital questions for any HPC site: – Is this application optimized for the system it is running on? – Does it benefit from running at this scale? – Are there I/O or networking bottlenecks affecting performance? – Which hardware, software, or configuration changes can be made to improve performance further?
There are three different methods to generate the performance report, which are described below. You can use any one of the methods.
-
Using executable file: To generate the performance report, use the following command:
$ perf-report ./executable_name.exeReplace the
executable_name.exewith your program. This command generates the two files with.htmland.txtextensions, which can be viewed using the browser. -
Using previously generated MAP output file: If you have already generated the
.mapoutput file using the MAP tool, then you can use the following command to generate the performance report.$ perf-report profile.mapReplace the
profile.mapwith your MAP output file. This command generates the two files with.htmland.txtextensions which can be viewed using browser. -
Using MAP interface: You can also view or export performance report from
Reportsmenu available in the menu bar of theMAPinterface as shown below: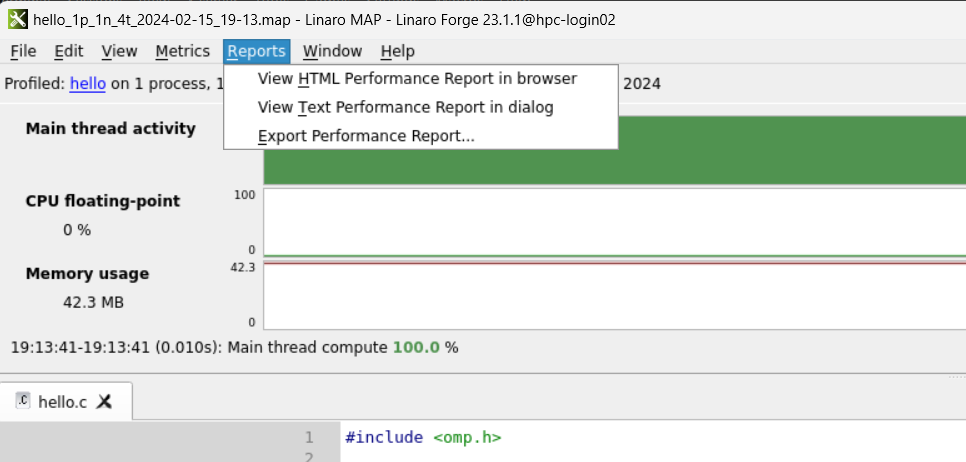
For more details, visit the online documentation.
Sample bash script
The following is an example of the jobscript, which can be used to offline debug, profile, and generate the performance report while queuing your job to the HPC nodes.
#!/bin/bash
#SBATCH --job-name=profiler         # name for your job
#SBATCH --partition=short           # partition to run in
#SBATCH --ntasks=1                  # total number of tasks across all nodes
#SBATCH --ntasks-per-node=16        # total number of tasks across all nodes<
#SBATCH --time=00:30:00             # total run time limit (HH:MM:SS)
#SBATCH --output=omni_%x_%j.out     # where to save the output ( %j = JobID, %x = scriptname)
#SBATCH --error=omni_%x_%j.err     # where to save error messages ( %j = JobID
#SBATCH --mem=75G                  # 75 GB RAM

# Purge modules to get a pristine environment:
module purge

# Load default module
module load DefaultModules

# Load Linaro Forge
module load debugger/linaro_forge

# Command to offline debug
# replace `executable_name.exe` with executable program
ddt --offline ./executable_name.exe

# command to generate map profile
# replace `executable_name.exe` with executable program
# replace output file name 'profile'
# this generates a 'profile.map' file which can be viewed through Linaro MAP tool.

map --profile --output=profile ./executable_name.exe

# command to generate performance report
perf-report ./executable_name.exe
We highly recommend reading the online documentation provided by Linaro Limited.